In this page I will share with you my tasks that I have done in this course:
Technology Timeline |
Classroom Floor plan |
|
This timeline shows us different technology tools that we have used within those 17 years in our classrooms.
Not all the teachers prefers using technology, but in my opinion all teachers should use it because technology made everything way easier than before, it also benefits both the teachers and the students.
|
It's a classroom layout that I have deigned by myself on my own opinion that it's the best way for students to be sitting during the class.
In this seat arrangement students will be able to focus with the teacher and see the board without turning their seats around while everyone is facing the board, also students will be able to work in groups or in pairs.
|
Google Drive as a Collaborative Tool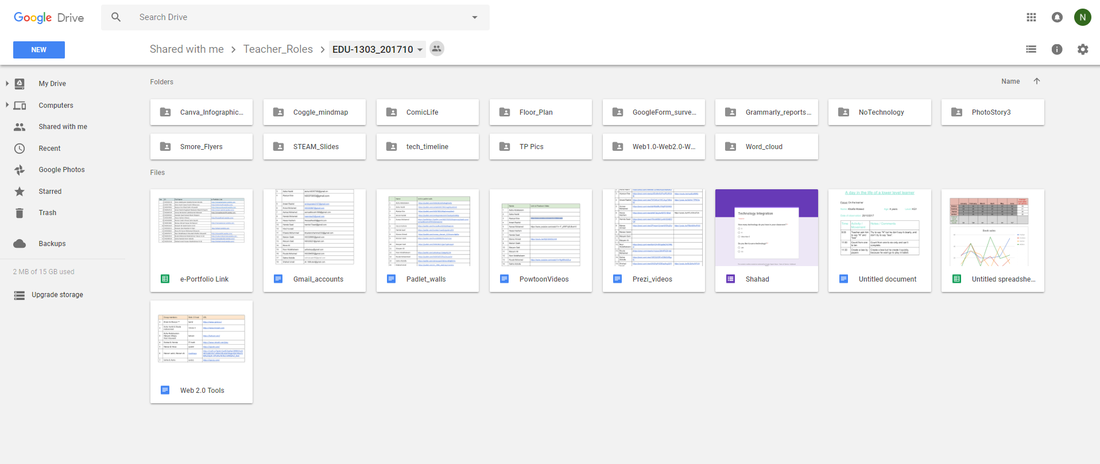
We used google drive to share our work with our colleagues, it's an easy, useful and helpful tool were your colleagues and teacher can access to it and upload it in their laptops. We can also work in groups accessing the same page at the same time.
|
Grammarly ReportsGrammarly is a website were you write your text in and it will show you where are your grammar mistakes exactly and it will give you the right correction that suits in your sentence. It's a really useful tool that helps you to develop your grammar in writing.
It shows me my mistakes by underlining them, and the right words will appear on the side. Just by clicking on the word it'll immediately auto-correct your mistake.
|
Word Cloud About BabblingI used "WordArt.com" to create my word cloud. It's a footprint shape created by words surrounding the shape, those words are sounds of some babbling the babies says when they starts talking.
|
A Mind Map About Hardware in Education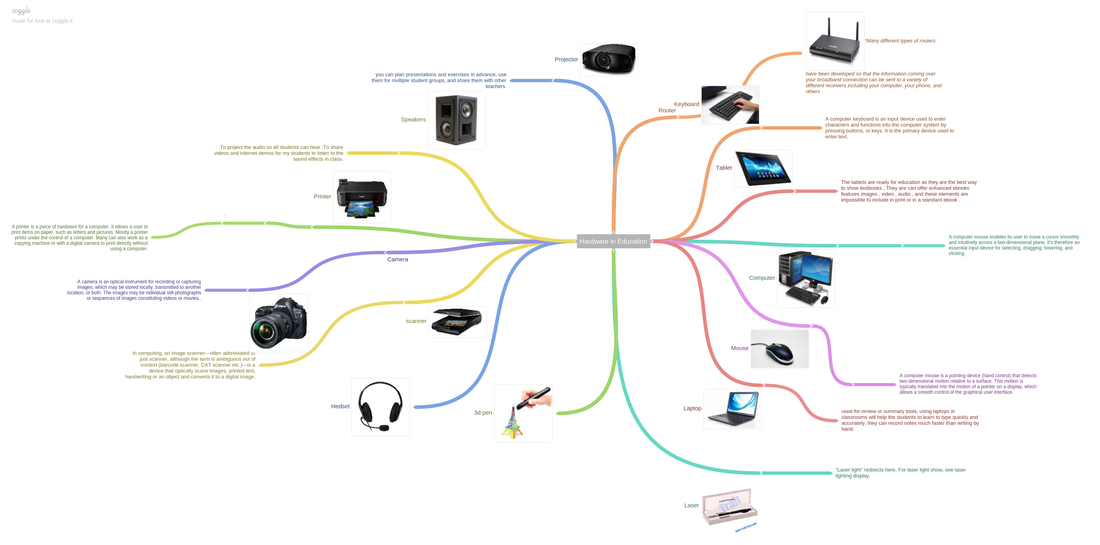
Mind map about different technology's hardware which are used in education by a teacher or a student, including their picture and uses. Those hardware are helpful to the teachers and students in all ages, whether they are in school or university.
I used a program called "Coggle.it" to create my mind map, it was an easy and helpful website.
|
A Story Through PhotosThis is a video story which I created with my friend by uploading pictures from the internet and adding our own speeches in it to create an educational story for the kids to watch it and hear it at the same time by our voices, it's useful even for the kids who can't read because they'll be able to hear and see the pictures of the story while playing the video. My video is about learning how to count the money to buy an ice cream cone.
I used a program called "Photo Story 3" to create my story, anyone can download this tool from google and create their own story.
|
Web 1.0, 2.0, 3.0This presentation shows you the differences between the three webs and gives you an example for each one, so you will know what kind of web to use.
I chose a program called "PowerPoint" to make my presentation then I saved it as a PDF.
|
A Web 2.0 Site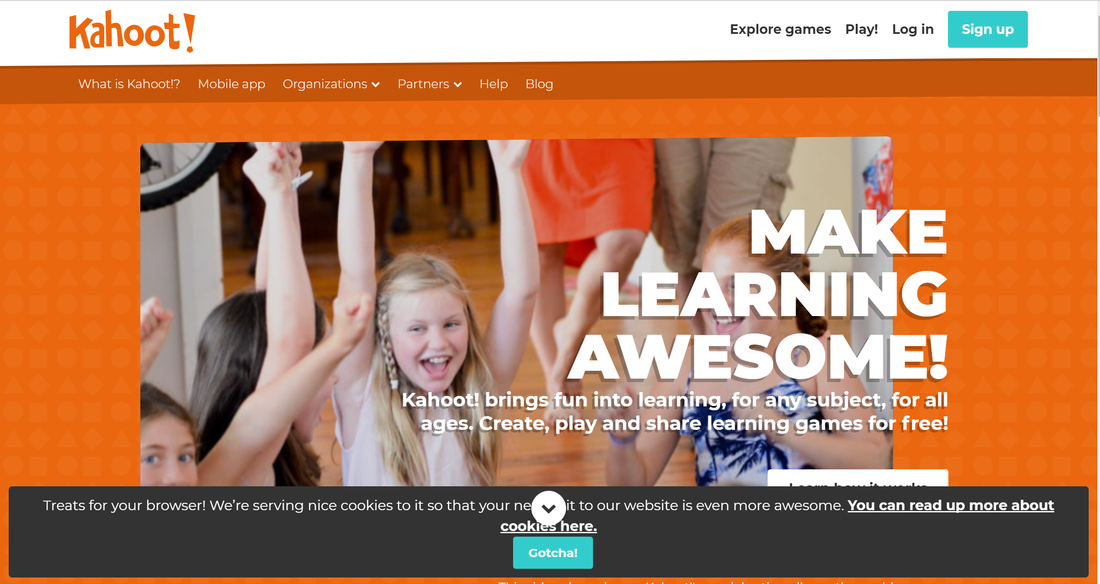
In the future, I'll use web 2.0 site because it would be easier and helpful for me as a teacher to use it, were I'll have lots and several choices of tools to choose. For example, I can use "Kahoot" to give the students a quick review at the end of the lesson to make sure they understood what I taught them during the lesson.
|
Smore Flyer on Interactive Learning EnvironmentIt's a flyer that shows you what does interactive learning environment means, it has some pictures and it includes a bottom, that'll take you to another page by clicking on it, so you can read more about the article, also there are some few questions that you'll have to answer at the end. There are some information about me and how to contact me.
I chose a tool called "Smore.com" to make my flyer and it is a good website.
|
STEAM Education SlidesThose slides are about STEAM Education they include the definition of STEAM, what does each letter reefers to, it's engagement, how's it with integrity, and it's development.
I used a google slide from google drive to make my presentation.
|
Powtoon Video About "Project Based Learning"This video is about "Project Based-Learning", it tells us what does it mean, why is it important, and what every good project needs.
I'll deliver the idea by creating the video as a story, in this way I'll attract the watchers and they'll concentrate on the video because it contains pictures and sounds.
|
A Prezi Video AboutThis presentation is about Robotics in Education, I wrote about the uses, pros and cons, my thoughts about it, some examples and how is it related to STEAM.
I used a website called "Prezi.com" to make my presentation, then I used "Screencast-O-Matic" to record my presentation with my voice, after I finished I saved it and uploaded it to my YouTube channel.
Making it as a video is really useful, were anyone can watch it and hear it in few minutes the way you talked about it and explained it. You can also upload it on YouTube for anyone to watch and benefit from it.
|
A Day in My Life With NO TechnologyBy clicking on this bottom it will open a new window to the website of the video I created. It was created by choosing the character you want and typing what do you want the character to say, so when you'll play the video, the character you have chosen will start saying what you wrote.
I chose a website called "Voki.com" to create my character.
|
My Padlet WallThis is my poster; I wrote my question and my classmates visited my page by the URL I shared with them, and they answered my question, after that I accessed to my page and wrote some comments on their answers.
I chose a tool called "Padlet Wall" to make my own poster.
|
Video Tutorial on Social Media for Educational UsesThis is a video tutorial that shows you how to use YouTube, how to make an account and how to upload your videos online.
I chose "Screencast-O-Matic" to record the screen and I had to explain everything with my voice such as, uploading their videos online.
Any one can use it and people can make their own channels, so they can upload their own videos and tutorials to teach people about different tools. People could also upload some educational videos for the children to watch and learn.
|
Video Tutorial: How to Use TwitterThis video tutorial shows you how to use "Twitter", how to make an account, follow people, edit your profile by editing the photo, header and sending tweets.
I used "Screencast-O-Matic" to record the screen while I was explaining how to create their own flash cards.
Anyone can use it and create their own accounts to share their things with others such as, thoughts, photos or videos.
|
Online Survey ToolIt's an online survey were you can write your own questions and choose the way you want them to be answered. Then you can share it with others, so they can answer the questions of the survey and when they'll finish answering the survey their answers will appear to you and you'll see how many responds you have received.
I did this online survey by a tool called "Google Form."
|
Canva InfographicThis is a poster that I did depending on the questions and the results that have appeared in "Google Form", I had designed it as a poster to make it easy for anyone to read the question and see the final result.
I chose "Canva, info-graphic" to make my poster.
|
An Educational ComicThis is an educational comic that I have designed, it's about a teacher who's giving the students a math class about counting shapes.
I used "Comic Life 3" to create and design my own story.
This tool is helpful for the teachers if they want to make a comical story for the students and it's an a easy tool to make the idea reach to the students. According to Kristie S. Fleckenstein sees: "the relationship between image and text as "mutually constitutive, mutually infused"—a relationship she names "imageword". Fleckenstein sees "imageword" as offering "a double vision of writing-reading based on [the] fusion of image and word, a double vision of literacy."
|
Microsoft Excel - Spreadsheet 1
In this task I did some calculations for the students grades in the 3 assessments, final grade of the 3 assessments per student and the average for the 3 assessments. To compare them easily, I chose the results to be shown in bar charts and pie chart.
|
Microsoft Excel - Spreadsheet 2
In this task I did some calculations to get the total of book sales for each month, the average of book sales per genres and I did some filters, so it becomes easier for anyone to find the information they want by choosing the column and row they select to appear. Also, I did a line graph about book sales in every month were you can read the information easily.
| ||||
An Interactive Image About UAE Map

It's about UAE map, I used tags on the map were each tag refers to an emirate, so we have seven tags on the seven emirates and each tag includes a picture of the president with his full name, of that emirate. This way it'll be easy for others to know the seven presidents of each emirate, for example if you clicked on Abu Dhabi's tag, the president's name which is Khalifa bin Zayed Al Nahyan and his picture will appear.
I used a tool called "Thing link" to make this map, it is an easy and useful tool.
